If we think of world experts, we often think of people, that are candidates for the Nobel prize. We tend to have the believe, that we will never be able to achieve such a status. Actually most of us probably don’t even think about getting to this level.
This is why we are so happy to have Claire Brittain as our guest on the show. In an ordinary role of a statistician working in early phase, she has done outstanding work.
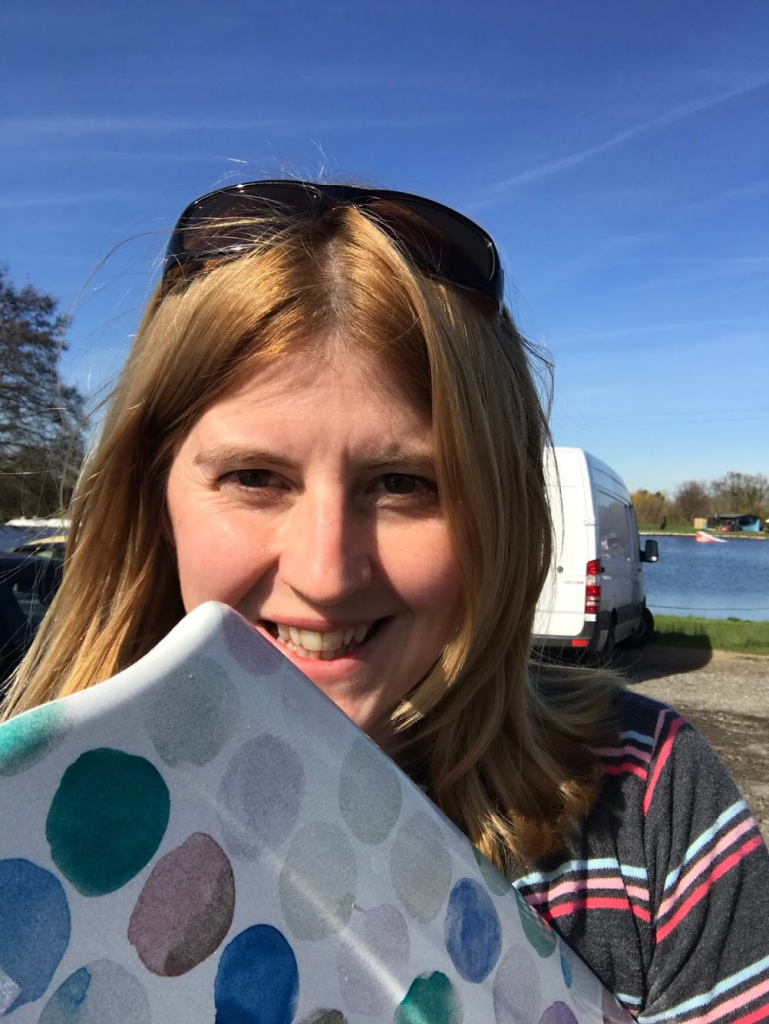
Claire Brittain
Claire has worked in medical statistics for 15 years with most of those years in early phase pharmaceuticals. Until recently she has resided at Eli Lilly, but by the time you listen to this podcast she’ll be at UCB. After a secondment to preclinical in her GSK-years she became interested in translational and methodology studies taking pleasure from making statistics pragmatic with science at the heart of any discussion.
She became increasingly interested in PSP when a friend of the family was diagnosed with CBD (the sister disease to PSP). Seeing the impact of the disease first hand and the acceptance that there is no cure motivated her. This podcast is about her journey to understand the disease better and potentially improve the probability of success of a future asset.
When not at work you’ll tend to find Claire with her feet attached to a wakeboard, chasing her 3 small boys or a glass of rum and coke in her hand… usually not all at the same time!
Listen to her story of how she came to be called a world expert on Progressive Supranuclear Palsy (PSP), a rare neurodegenerative disease.
This amazing story has lots of learnings for each of us.
Finally, Claire will present a poster about her work at the PSI conference in Amsterdam. Actually, it’s not just a poster, but listen to the episode and you’ll learn what’s so special there.

Featured courses
Click on the button to see our Teachble Inc. cources.
Transcript
How to become a world expert in an indication as a statistician – Interview with Claire Brittain
00:00
Hi, it’s only a couple of weeks until we have the PSI conference in Amsterdam. On the Wednesday afternoon, there’s a session on regulatory topics. You can submit a question just by sending me an email at alexander at thee or of course you can submit your question also in the conference home page. Any questions that get submitted to me, I will then provide a summary about.
00:28
from the session in an episode after the conference. So just submit something to alexander at thee Now to this episode. You will hear some noise in the background sometimes. Sorry, this is my little girl crying outside of my door because I recorded this session at home. And now, the music.
00:57
Welcome to the Effective Statistician with Alexander Schacht and Benjamin Piske. The weekly podcast for statisticians in the health sector designed to improve your leadership skills, widen your business acumen and enhance your efficiency. In today’s episode number nine we have an interview guest Claire Britton. We’ll talk about how she became an expert on PSP, actually a world-class expert on this indication.
01:24
We’ll talk about her challenges, her obstacles, how she overcomes them and what are the key learnings from that. This podcast is sponsored by PSI, a global member organization dedicated to leading and promoting best practice and industry initiatives for statisticians. Learn more about upcoming events at psweb.org and especially learn about the upcoming conference in Amsterdam. Register now!
01:58
Welcome to another episode of the Effective Statistician. Today, I’m as usual with my co-host, Hi Benjamin. Hi Alexander. Very good. And I have a really, really nice guest that I know for quite a long time, Claire Britton. Hi Claire. Hello everyone. Okay. Today, we have actually a very, very special topic because it’s about
02:27
becoming a world-class expert on a new indication. And it’s such a nice story here with Claire that I absolutely wanted to have an episode about this. The indication is actually progressive supranuclear palsy, just refer to PSP. It’s a rare neurodegenerative disease.
02:56
And Claire has worked on that quite a lot and becomes so well known for it that she got called a world-class expert by externals. But first, maybe let’s go a little bit into an introduction of you, Claire. So maybe you can speak a little bit of what you’re doing at work and outside of work. Hi, Alexander. Thank you very much for that introduction.
03:26
Well, it’s probably never good to start a world expert podcast by saying that you’re actually currently between jobs. But unfortunately, in my case, it’s true. So I previously worked at Eli Lilly where all of this work has been done based in the UK office. But I’ve recently got a job offer for UCB, which I started on Monday.
03:56
So anything from discovery right up to phase two with some clinical farm work within the submission packages as well. So yeah, very excited about the new possibilities, but also I’m excited to talk to you today about what’s been going on as well in my past life at Lilly. I’m still actually working on the paper to get the manuscript out at the moment. So that’s definitely taking up my evenings. And then outside of work, I’ve got three small boys that keep me
04:25
very busy and on my toes. I like to do a bit of running and I find my best breakthroughs, statistics and just for relaxation come when I get an opportunity to go wakeboarding. So that’s how I get my kicks I suppose. Yeah, wakeboarding, you’re very, very good at that. I remember once we got, went wakeboarding as an after work event. That was quite impressive.
04:57
Okay, very good. In terms of PSP, can you explain a little bit what that is and how you got involved with it? Sure. So it’s a rare neurodegenerative disease. A lot of the time it’s misdiagnosed, actually. It’s so rare that clinicians might only come across one or two cases in their careers.
05:25
The estimates vary, again, because apparently 50% of cases aren’t actually even diagnosed until autopsy, but it’s thought that the prevalence is around five per hundred thousand. It’s usually misdiagnosed as Parkinson’s, often potentially for the whole lifetime of the disease, but sometimes for a few years until they realise that the L-Dopa is not doing anything for the patients.
05:51
But it’s quite different from Parkinson’s in some ways. In the Parkinson’s, you’re very, very focused around the tremors and the falls, whereas here, one of the hallmarks of the disease is issues with eye movement. So patients, their eyes, quite early in the disease will get fixed in one location, or they find it very, very hard to focus or have tunnel vision. If you pair this with the fact that they’re also gonna have difficulty with balances, they fall, there’s issues with gaits.
06:20
some Trevor, you can imagine that’s quite a debilitating start of the disease. So from diagnosis to it being terminal, you’re talking about five to ten years, I think the average is about seven years, so it is definitely a terminal diagnosis for these patients. And towards the end you’ll see rigid paralysis and usually difficulty swallowing, which would add to the risk of infections.
06:48
Unfortunately, it’s quite a sad disease in that there are no treatments available at the moment. I don’t believe there’s anything, even at the moment, there definitely are things in clinic but none at the moment that have reported that have shown any promise. There’s been four or five phase three trials in the last five years but none of which have shown any efficacious benefit to placebo unfortunately. But these patients themselves will be on a lot of symptomatic treatments which have limited benefit.
07:16
one of the more useful ones is that for this issue with eye movement, they have Botox injections, which helps control some of those symptoms there, which at least keeps the site going a little bit longer. Okay. So, yeah, tricky disease.
07:33
Yeah, sounds very poor patience for these ones. So how did you then get involved with this? So I’ve worked in the last couple of years primarily in Parkinson’s and Alzheimer’s and what’s opened up the window for this disease in recent years is you can imagine it’s a rare disease from a pharma company point of view. There’s not going to be a whole lot of…
07:59
huge benefit, unfortunately, financially for people getting into this disease. But what causes this disease is if you’ve done any work in Alzheimer’s, you’ll know that Alzheimer’s is caused by two hypotheses, the amyloid hypothesis, so build up an amyloid that causes plaques in the brain, but also the tau hypothesis of where you get too much tau in the body, which then also builds up and causes tangles in the brain. So for Alzheimer’s, you’ve got both of these things, which very much complicate
08:30
what you’re looking at and how you can make treatments for it. And possibly one of the reasons why breakthroughs and out-summers in recent years have been so tricky because we perhaps need to attack both of these, which I know a lot of people, a lot of companies are trying to do at the moment. PSP has the beauty within this that it’s actually what we call a pure tauopathy. So it doesn’t have any of the muddiness of the amyloid hypothesis in that it is just the buildup of tau that is causing this disease.
08:54
So that means from a drug perspective, if you’ve got something like a tau antibody or a tau vaccine, you could use your PSP study as a proof of mechanism for your drug. So if you know it works in PSP patients, you then know it’s doing something to the tau and therefore may be able to help your Alzheimer’s patients as well, which is obviously where the large market and where a lot of pharma companies are trying to focus at the moment. So primarily I was working on Alzheimer’s drugs and this is kind of a sideline, but we can use it.
09:24
as essentially a proof of mechanism within the Alzheimer’s environment as well.
09:30
very interesting indeed. I didn’t even know this practice of indirect use of patients is being used. Yeah, it’s definitely an interesting way of working and it’s interesting depending on which government’s board you speak to as well to how much they’ve done in that hypothesis. But it definitely does make sense. Unfortunately, the way the TAL works in PSP patients, you can’t actually scan for it with the floor TAL-superscan.
09:59
So it’s also yet another assumption you’re making that if you’ve made these patients better that you’ve done something to their towel. But you can measure it in their blood in the free-flowing towel. So it is something that we could potentially have an impact on. Alexander mentioned before that you have been called a world expert on PSP. Can you just give me some more information about this? What happened? I think world expert is probably not a phrase I would use. I have no…
10:27
in a cool background or though. Actually, actually, I said world class experts. Okay, good. Okay, I think I can settle for that. Um, yes, I guess, I guess that is true. But I think the main thing for me is that this is a small playing field. It’s a very rare disease. There’s yes, there are more people working on it than nowhere previously. But it’s not like Alzheimer’s where you’ve got.
10:52
thousands and thousands of people working in this disease space. It’s still a very, very small area. So in terms of being an expert in it, it is a small area. But I think, I guess where I’ve managed to make that transition to actually do more than a statistician is where I’ve managed to make a contribution within the medical field itself, within the actual science and the scale, rather than just analyzing data from a study.
11:22
I’ve actually made a contribution that I know seven of our clinicians are showing this to patients with PSP to give them an idea of how their disease is going to progress. Because this is such a rare disease, and as I said, clinicians may only see a few patients in their lifetime, the first question a patient is going to ask is, well, what’s going to happen next? And that’s always been quite a difficult question for the vast majority to answer apart from those that are really top in this field.
11:50
Whereas the tool that I’ve produced means that they can actually look at their score currently on the scale and progress it over time and actually give patients an idea of what will change for them over time. So how they can adapt their lives as they’re moving forward. Can you tell a little bit about this analysis and what exactly you did there and also where you got the data from for this? Sure. So…
12:17
Well, the data itself. So I, early on, we started working with definitely a world expert in this called Adam Boxer. And he is, he’s an external expert. And he, he knew our medical director Michael Irizarry. So when we started working in this, I got very interested in the rating scale that’s used for this. And again,
12:44
worked in Alzheimer’s for a few years. The rating scales that we use for Alzheimer’s are notoriously variable. There’s arguments about which ones capture the disease, etc. What was really, really interesting about this rating scale is that there’d been just these four phase three studies using this scale, but all of them in the placebo patients were showing the same progression over time for the year with very, very similar standard deviations. So as a statistician, you can…
13:11
You can imagine that firstly raises a few alarm bells, but also a lot of interest because if a scale isn’t variable and you’re showing a decent rate of progression over the year, statistically that’s really interesting because we’ve got a chance to actually make a difference on the scale that we can actually detect in a relatively short amount of time, which is one of the problems we’ve had with Alzheimer’s. So
13:34
When Michael Irizarry suggested talking to Adam about this, I jumped at the chance and I’ll be honest, I was a little bit nervous going in talking to this guy who clearly, this was about three years ago now, clearly is very much top of his field when you’re going in and you know nothing other than a few literature searches that you’ve done. But he was very knowledgeable, he answered a lot of my questions and he then, he actually called me out in the meeting and said, well…
14:02
what are you actually asking for here? And what were you really interested in? And I confess that actually looking at the scale more, I was confused by the fact that some of the questions were rated differently. So for example, tremors was rated on a scale of naught to two with two being the worst possible tremors. But falls was, how many times were fall was rated naught to four. So two was a kind of mediocre score for that. So you could get twice as much.
14:31
points effectively for having poor falls. And he said, well, would it help if I could let you see the individual data for this? And you can imagine as a statistician, I was slightly floored that somebody from a previous study was offering me data externally at an individual patient level. So I tried very much to keep my cool and said, well, this might be useful to me. Yes, I think this would be very good. So he was obviously very, very polite.
15:00
But then he made it quite clear that if he was to give Louis this data, he wanted something back in exchange more than just satisfying my curiosity about the scale. And by fluke, we’d had a recent stats face to face about with our EU group and someone that Alexander works very closely with. So Carsten and Mark Belger and Jeremy had done some really nice analysis within Alzheimer’s.
15:28
that if you knew your total score for this Alzheimer’s scale, you could predict how people’s domains might be. So if you knew your total score was 70 out of 100, you could predict that your cognition would be 70% impaired, that your balance would be 30% impaired and so on. And it’s just this kind of
15:50
went past my mind as I was in this meeting with this incredibly important person, I started telling him about this analysis and he said, well, that’s something that we’d be very, very interested in within the field. And I was thinking, as I was saying, I was thinking, I have no idea if I could reproduce this. I have no idea if it would work for this scale or not, if it’s even applicable to this disease area. And he said, well, I’d be very interested to hear it. So I…
16:12
I said, yes, I’ll put together a proposal, which I did by the end of the week. And I sent it off to him and I had a chat with Carson and Jeremy in the meantime, and they agreed that actually this scale could lend itself towards this analysis. And a week later, the data was on my desk, which was amazing. So it’s 300 patients with their individual scores, with their individual question scores within the total scores.
16:38
And I could start actually properly exploring this. And imagine 300 patients, when you think about the fact that only three or five per 100,000 have this disease, to have a wealth of this data sitting on your desk, it was an incredible opportunity and it was very hard not to spend all my time on it. Because obviously I had other projects at the time as well. So in terms of the analysis, can you…
17:07
tell a little bit about kind of the structure of the questionnaire and how that relates to then the subdomains and how you kind of have shown that? Yeah, sure. So you’ve got six subdomains and for PSP they’re things like balance and this eye movement and then there’s a domain called history which is very confusingly named but it’s basically how many times have you fallen in the last week, how many times have you struggled with this in the last week.
17:35
and then there’s one on swallowing and two other domains as well. And these are added together to make the total score. So the idea of the analysis is that if you know someone’s total score of, say, 70, which would be quite a severe score, you can predict what is the probability that you’ve reached impairment and we class impairment as 25% of the total score for that domain. What’s the chance of you getting to impairment in your ocular?
18:04
for example, what’s the chance of you having hit impairment for your balance and so on. And what you can start to see is as you change that score, so we start it from about 10 out of 100, you can see at 10, the chances are you’ve only got impairment on your ocular, which doesn’t surprise us because that’s the hallmark for the disease. And then once you get to about 20, your balance, that’s very, very quickly goes between a score of 20 and 30, your balance goes from
18:33
really not impaired, hardly any patients have an impairment, to almost full impairment on a scale of just 10 there. And that’s a really interesting finding, because it means if you’re taking people that are too severe and your drug is trying to attack something that would help their balance, if you take people on a score of 50, you’ve already missed your window. So it’s really about trying to find the sweet spots, what spots within it is what it’s really useful for. And so what’s behind that is proportional odds modeling.
19:02
for working out those initial curves. And then what I’ve done is I’ve just translated that into bar charts. So quite boring traffic light bar charts. So one for each domain. So green being a mild impairment, orange being a moderate impairment, and red being a severe impairment. And then what the tool allows you to do, which I’ve put together in R Shiny, is to move the slider for the total score. And you can see how these traffic lights change. So you can imagine in the 10,
19:30
side of this, everything’s looking quite green with a little bit of amber. But by the time that score gets towards 60 or 70, almost everything’s going red. But what’s interesting between that is when does each domain go red, because they all change at different times. And that’s what’s been really useful for us. Yeah. And I think what we have done for the Alzheimer data is there we have used also an Alzheimer total score and had similar subdomains.
20:00
And so you can basically kind of see at which time point in the disease, which symptoms are mostly affected and mostly changing. Because if you look into these total scores and at the earlier changes, so on more mild changes, you have completely different domains affected.
20:30
So if you move, let’s say for the MMSE for Alzheimer, if you move from 30 to 25, so actually that is lower scores means more severe impairment, you have completely different areas affected than if you go from 20 to 15. Exactly. We need to put this in a context of clinical trials. So for us,
20:59
the ocular impairment, for example, patients, by the time the average patient, which is a score of I think about 37, enters the clinical trial, they have already reached severe ocular impairment. So unless your drug can reverse ocular impairment, you will not have any impact on it. You cannot stop the aggression because it’s already fully progressed. And that’s what the outcome shows as well. And I think that’s where something like this can be really, really powerful because suddenly it’s changed your entry criteria.
21:26
I think that’s where it’s going to be used more than anything. Or at least, even if it doesn’t change the entry criteria, it sets expectations when you’re recruiting patients because you can show them this tool. So yeah, Alexander, your work with Carson and Jeremy was really interesting because it’s a video. I was very fortunate to be able to link up with a very, very talented R.Shiny programmer called Andy McCarthy, who was able to, he looked at the video and he said, well.
21:52
why on earth would you make it a video when you can do it in our Shiny? And I realized things have moved on since you guys have done it. And I said, no, no, you can’t do this in our Shiny because what we want, we need to move over time. He says, no, of course you can move it over time. And you can go one step further and make it interactive. So rather than have to pause a video to find your individual score, there’s just a simple slide on the bottom that allows you to move it to where you want. So you can watch it animated or you can actually play with it as well, which is.
22:22
for us was that next step was a big breakthrough. I think another aspect is there if you can much better understand variability over time. So I think one of the problems of these scales is that you add the variability from all these different subdomains together. And whereas for certain changes, individual patient changes, actually…
22:50
only variability from certain subdomains should be taken into account. So if in an overall analysis, we would be able to kind of more kind of focus on specific subdomains for specific severities of the disease and then analyze data that way, I think we could have a dramatic.
23:16
improvement in terms of the preciseness of our studies? I definitely agree with that and that’s something I looked into is whether or not we could do an interim analysis based on one of the subdomains. Unfortunately, the total score is still actually the highest effect size throughout but to make it very clear that one of the subdomains is very, very close to the effect size of the total scores.
23:44
So that’s interesting in itself because that will help us have confidence if we do do a very early interim analysis on not very many patients at all. Yeah, and I think the effect size is probably different for different subgroups. It is very much so. Yeah, very much so. If you have different subgroups by baseline severity, you will have very, very different effect sizes because for…
24:11
For those areas where you already have complete impairment and there’s no kind of progression possible anymore, you can’t see anything, any treatment effect by definition. Whereas for those where there’s exactly kind of see the area where the change is happening, there you can actually stop the progression and see the effect. So I think we need to more…
24:39
look along these lines and that I think could make a big difference for lots of these questionnaires that have this feature that for different total scores you have actually different parts of the questionnaire affected. Definitely, particularly if there are treatments that are specifically trying to attack one domain rather than the health spectrum, I think that will be implicitly important. Yeah.
25:08
So in terms of getting these data and coming to this analysis, what were the biggest obstacles that you had?
25:19
I think initially the biggest obstacle was my level of interest in this versus how much other work I had. Because until I started to be able to show anyone anything with this, and really that probably wasn’t until we could get this working interactively and we could start showing it to people within our function.
25:40
It was hard to kind of carve out the time to work on this. I think that was early on, I think that’s always the thing with statisticians, trying to find that extra time. Not so much an obstacle, but I guess more of a breakthrough was the linking up with the R Shiny. I think that was a really big breakthrough there. And also not so much an obstacle, but…
26:07
probably more of a huge learning for me is I took this work. So initially I had just this one data set for a drug called divinotide, which had the 300 patients in. And I took this work to a medical conference on frontal temporal dementia, which PSP is part of, to a conference in Munich. And I went along with a poster, probably not dissimilar to the one that I might be taking to the PSI conference.
26:36
highly statistical, lots of detail on the methods, lots of things about logic functions and link functions. And I stood there at this medical conference, it took me about three or four seconds to realize I’d completely bought the wrong poster with me. This was not something that was appropriate for a medical conference in any way, shape or form. There are people there at the medical conference that obviously are clinical have some
27:00
medical background, have some scientific background. There’s no statisticians there. I was the only statistician in the room. There’s also people there that are patients, that are carers. And I’m standing by my poster trying to justify my work, which ultimately when I first worked on this, I was quite removed from the actual disease itself. You’re just looking at numbers, aren’t you? And being at that conference, you realize that this is actually something that’s very, very real.
27:28
very very personal to some of these people and I’m standing there trying to explain 95% confidence intervals on these curves. So what was nice about this conference is the poster part of it was a huge part and people spend a lot of hours walking around looking at these different posters so I managed to adjust the way that I would talk about this primarily by standing almost and totally in front of my poster obscuring it.
27:54
and instead just trying to talk to people about what I was trying to do and what I was trying to achieve. And what I didn’t realize at the time when I was there that there were actually three other investigators there and they were the three investigators that had worked on the other phase three trials. And afterwards they contacted me through an inboxer and said that they’d really like to lend their data to this model. And so therefore instead of having just one drugs
28:24
trials that have been done in late phase. So within a month of coming back from that conference, I had in house every placebo subject that has been in a submission trial in the last five years. You can imagine then the breadth of what this analysis is covering. I was also petrified because it had worked beautifully on one day’s set and whether or not it was going to work on the other three as well was another question.
28:50
It was a huge opportunity for me, but also a massive learning about if I ever go to medical conference again, that being exact in terms of statistics is not what you need on your poster and actually something far more accessible. But talking to people, I think that’s what really helped it there. Okay, that already leads me to another question. What kind of advice would you give to other statisticians to raise their profiles in such a way externally? So to become…
29:19
experts in a specific way. And I mean, you already talked about some obstacles to overcome. And I think, you know, coming back from the conference with new data doesn’t help you with your workload. So what would be your advice or other advices that you had for statisticians? I think definitely look for these opportunities. I think particularly in an area like this where there hasn’t been much progression in the last years, there’s starting to be now.
29:48
I think there’s a lot of room for what statisticians can achieve within it, just in a statistical manner. But I think for me, the biggest learning was to not be afraid to contribute scientifically. Don’t be held back with the thought that I’m surrounded by these medical experts, these scientific experts. I can’t make a contribution scientifically or statistically, only statistically. So I was…
30:16
I was surprised I was able to make such a large contribution from a medical perspective, but what was interesting is that the guys I was working with weren’t surprised at all. So I think that was a big learning for me and that I find very encouraging for myself and other statisticians that people don’t expect us to stay in our box and just do our numbers, they are actually expecting us to make these contributions at a high level when we can. So look for those opportunities and don’t be afraid of them, would be my advice.
30:45
Thanks so much. And this year, PSI conference has this post about PSP. So that will be really, really good. In terms of my learnings, actually, there’s a couple of things from here. So first is, I think, working together with these key opinion leaders, with these medical key opinion leaders, is really something that we as statisticians need to play a part in.
31:14
bigger part in. We shouldn’t just hide between our medics that work within the pharmaceutical industry. We can work directly with these. And this is an example where that led to really, really nice outcomes. The other thing is, I think we need to get out of our comfort zone sometimes of just sitting behind our computer and actually speak to these people.
31:43
being at, you know, through this phone calls that you had with the first investigator or engaging at the conference, presenting their research. And I found it really nice how you adapted to the audience, because I think that’s another big learning is kind of, when you present, you need to have your audience in mind. And…
32:10
Well, if you didn’t have it in mind, like in your case, you can adjust for it. I think another key learning, I think, is also this trying something out that is new, that is different. And what I found really nice is that you kind of learned from different pieces there. So you looked into other areas, like the Alzheimer’s space.
32:36
You worked with the stats analyst, so you leverage networks there to get something nice from a programming point of view. And that you brought all these kind of different puzzles together. So I think that is also a great way of getting things done. You don’t need to do every little single task yourself. You can actually learn from others and work together with others.
33:06
which is really, really great. And so, but taking this initiative in the first place and not letting this ball drop, I think, is one of the key things to kind of start it and go from it and drive it and move it forward to the end. Thank you. I’ve really enjoyed working on it. It’s something that I have wanted to see too, even though
33:35
I’m off on leave now and I’m in the process of changing companies. I think it says something about it that my new company are willing to support me going to the PSA conference because they see the value in this work and that makes me really, really happy that it’s been recognised in that way and that I do still get to show what I’ve done in the last few years. So I hope a few people might come past the poster and have a look. I’ll have it working on the iPad so people can actually have a play themselves.
34:06
I will look at it. Thank you. That’s one person. I’ve seen it already. Okay, very good. So, thanks so much for spending the time. Thanks a lot, Claire. It was really great. It’s been a pleasure. See you all in Amsterdam. Bye. Can’t wait. Take care.
34:30
We thank PSI for sponsoring this show. Thanks for listening. Please visit thee to find the show notes and learn more about our podcast to boost your career as a statistician in the health sector. If you enjoyed the show, please tell your colleagues about it.
Join The Effective Statistician LinkedIn group
This group was set up to help each other to become more effective statisticians. We’ll run challenges in this group, e.g. around writing abstracts for conferences or other projects. I’ll also post into this group further content.
I want to help the community of statisticians, data scientists, programmers and other quantitative scientists to be more influential, innovative, and effective. I believe that as a community we can help our research, our regulatory and payer systems, and ultimately physicians and patients take better decisions based on better evidence.
I work to achieve a future in which everyone can access the right evidence in the right format at the right time to make sound decisions.
When my kids are sick, I want to have good evidence to discuss with the physician about the different therapy choices.
When my mother is sick, I want her to understand the evidence and being able to understand it.
When I get sick, I want to find evidence that I can trust and that helps me to have meaningful discussions with my healthcare professionals.
I want to live in a world, where the media reports correctly about medical evidence and in which society distinguishes between fake evidence and real evidence.
Let’s work together to achieve this.